Eco-Visio 5

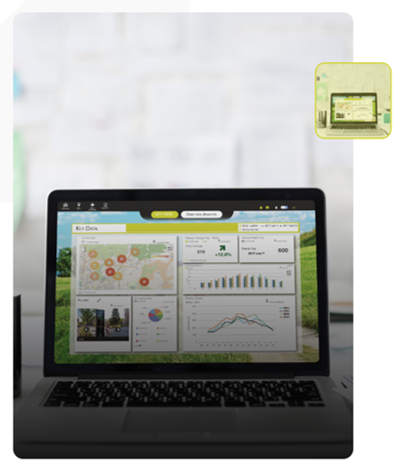
Eco-Visio 5 is our online, easy-to-use data analysis platform, to perform powerful analysis of bicycle/pedestrian counts. It presents your count data in the form of easy-to-use interactive dashboards, easily accessible from your smartphone, tablet or computer. This update allows you to save your preferred data analyses (such as hourly pedestrian profiles or peak day) and access them automatically with each login.
Applications
Benefits :
- Your preferred data analyses immediately accessible
- Dozens of data analysis modules (widgets) for dynamic data visualisation
- Easily share dashboards and reports with partners
System Overview
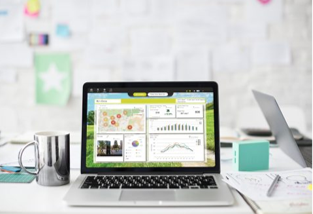
Dashboards consist of a variety of interactive ‘widgets’ – dynamic data visualization modules. Organise and personalise your dashboard as you wish with over a dozen widgets, including:
- Tables with automatically-generated key figures
- Interactive charts and graphs
- Maps of counter location and business
Widgets are dynamic, allowing you to easily filter counting sites, time-periods, or parameters. Explore these widgets directly on your dashboard – data is automatically updated and waiting for you when you login.


Analyse and Visualise
With Eco-Visio 5, your data analyses are presented in the form of a personalised dashboard. Data are visible at any given moment, saved in real time on your account.
Dashboards consist of a variety of interactive ‘widgets’ – dynamic data visualization modules.
Share Data, Collaborate More & Engage Partners
Eco-Visio 5 allows you to create reports, dashboards and widgets to be shared with partners – never has it been so easy to engage stakeholders and the public with your data. Export data directly or download it in Excel format – Eco-Visio 5 allows you to easily share your count data with partners straight from the platform.
Do you have a question? A project?
Feel free to contact us for any information related to a product


